Blog
2017-11-28
This year, the front page of mscroggs.co.uk will once again feature an advent calendar, just like last year and the year before. Behind each door, there will be a puzzle with a three digit solution. The solution to each day's puzzle forms part of a logic puzzle:
It's nearly Christmas and something terrible has happened: Santa and his two elves have been cursed! The curse has led Santa to forget which present three children—Alex, Ben and Carol—want and where they live.
The elves can still remember everything about Alex, Ben and Carol, but the curse is causing them to lie. One of the elves will lie on even numbered days and tell the truth on odd numbered days; the other elf will lie on odd numbered days and tell the truth on even numbered days. As is common in elf culture, each elf wears the same coloured clothes every day.
Each child lives in a different place and wants a different present. (But a present may be equal to a home.) The homes and presents are each represented by a number from 1 to 9.
Santa has called on you to help him work out the details he has forgotten. Behind each day (except Christmas Day), there is a puzzle with a three-digit answer. Each of these answers forms part of a fact that one of the elves tells you. You must work out which combination of clothes each elf wears, which one lies on each day, then put all the clues together to work out which presents need delivering to Alex, Ben and Carol, and where to deliver them.
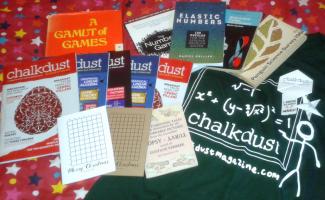
Ten randomly selected people who solve all the puzzles and submit their answers to the logic puzzle using the form behind the door on the 25th will win prizes! A selection of the prizes are shown below, and will be added to throughout December.
The ten winners will also will one of these winners' medals:
As you solve the puzzles, your answers will be stored. This year, there is a new feature allowing you to synchronise your answers between multiple computers: simply enter your email address below the calendar, and you will be emailed a magic link to visit on your other devices.
Behind the door on Christmas Day, there will be a form allowing you to submit your answers. The winner will be randomly chosen from all those who submit the correct answer before the end of 2017. Each day's puzzle (and the entry form on Christmas Day) will be available from 5:00am GMT. But as the winners will be selected randomly, there's no need to get up at 5am on Christmas Day to enter!
To win a prize, you must submit your entry before the end of 2017. Only one entry will be accepted per person. If you have any questions, ask them in the comments below or on Twitter.
So once December is here, get solving! Good luck and have a very merry Christmas!
(Click on one of these icons to react to this blog post)
You might also enjoy...
Comments
Comments in green were written by me. Comments in blue were not written by me.
2017-12-27
@neal (@zbvif): Thanks, I've added a clarification to 22Matthew
Me again
Just for info (clarification?): I read question on 22nd as
22 is two times an odd number. Today's number is the mean of all the answers, on days (including today), that are two times an odd number."
Note my added commas. I was averaging the answers, not the dates. Certainly ambiguous as far as I am concerned.
Only fixed it by 'cheating'. Trying best guessses of averages until I got the correct one.
neal (@zbvif)
Wow. Just discovered I meisread 15th Dec puzzle.
I can tell you that the number of combinations of n As and Bs which contain at at least one uninterrupted sequence of 3 As is 2^n - F3(n+3) where F3 is the fibonaccia variant adding 3 numbers (1,1,2,4,7,13,24 etc.).
Only took me about 8 hours (with some small help form OEIS for the 2 As problem)
I can tell you that the number of combinations of n As and Bs which contain at at least one uninterrupted sequence of 3 As is 2^n - F3(n+3) where F3 is the fibonaccia variant adding 3 numbers (1,1,2,4,7,13,24 etc.).
Only took me about 8 hours (with some small help form OEIS for the 2 As problem)
Neal (@zbvif)
With todays puzzle does the pancake have any thickness i.e can we slice the pancake into 2 circular pancakes each with half the thickness or are we to assume its 2D
Alex
Add a Comment
2017-11-14
A few weeks ago, I took the copy of MENACE that I built to Manchester Science Festival, where it played around 300 games against the public while learning to play Noughts and Crosses. The group of us operating MENACE for the weekend included Matt Parker, who made two videos about it. Special thanks go to Matt, plus
Katie Steckles,
Alison Clarke,
Andrew Taylor,
Ashley Frankland,
David Williams,
Paul Taylor,
Sam Headleand,
Trent Burton, and
Zoe Griffiths for helping to operate MENACE for the weekend.
As my original post about MENACE explains in more detail, MENACE is a machine built from 304 matchboxes that learns to play Noughts and Crosses. Each box displays a possible position that the machine can face and contains coloured beads that correspond to the moves it could make. At the end of each game, beads are added or removed depending on the outcome to teach MENACE to play better.
Saturday
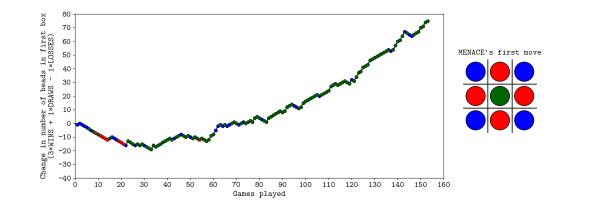
On Saturday, MENACE was set up with 8 beads of each colour in the first move box; 3 of each colour in the second move boxes; 2 of each colour in third move boxes; and 1 of each colour in the fourth move boxes. I had only included one copy of moves that are the same due to symmetry.
The plot below shows the number of beads in MENACE's first box as the day progressed.
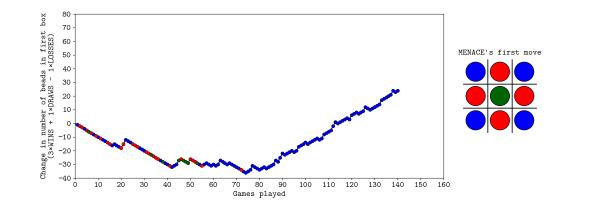
Originally, we were planning to let MENACE learn over the course of both days, but it learned more quickly than we had expected on Saturday, so we reset is on Sunday, but set it up slightly differently. On Sunday, MENACE was set up with 4 beads of each colour in the first move box; 3 of each colour in the second move boxes; 2 of each colour in third move boxes; and 1 of each colour in the fourth move boxes. This time, we left all the beads in the boxes and didn't remove any due to symmetry.
The plot below shows the number of beads in MENACE's first box as the day progressed.
You can download the full set of data that we collected over the weekend here. This includes the first two moves and outcomes of all the games over the two days, plus the number of beads in each box at the end of each day. If you do something interesting (or non-interesting) with the data, let me know!
(Click on one of these icons to react to this blog post)
You might also enjoy...
Comments
Comments in green were written by me. Comments in blue were not written by me.
WRT the comment 2017-11-17, and exactly one year later, I had the same thing happen whilst running MENACE in a 'Resign' loop for a few hours, unattended. When I returned, the orange overlay had appeared, making the screen quite difficult to read on an iPad.
g0mrb
On the JavaScript version, MENACE2 (a second version of MENACE which learns in the same way, to play against the original) keeps setting the 6th move as NaN, meaning it cannot function. Is there a fix for this?
Lambert
what would happen if you loaded the boxes slightly differently. if you started with one bead corresponding to each move in each box. if the bead caused the machine to lose you remove only that bead. if the game draws you leave the bead in play if the bead causes a win you put an extra bead in each of the boxes that led to the win. if the box becomes empty you remove the bead that lead to that result from the box before
Ian
Hi, I was playing with MENACE, and after a while the page redrew with a Dragon Curves design over the top. MENACE was still working alright but it was difficult to see what I was doing due to the overlay. I did a screen capture of it if you want to see it.
Russ
Add a Comment
2017-06-03
As a child, I was a huge fan of Captain Scarlet and the Mysterons, Gerry Anderson's puppet-starring sci-fi series.
As an adult, I am still a huge fan of Captain Scarlet and the Mysterons.
Set in 2068, the series follows Captain Scarlet and the other members of Spectrum as they attempt to protect Earth from the Mysterons.
One of my favourite episodes of the series is the third: Big Ben Strikes Again.
In this episode, the Mysterons threaten to destroy London. They do this by hijacking a vehicle carrying a nuclear device, and driving it to
a car park. In the car park, the driver of the vehicle wakes up and turns the radio on. Then something weird happens: Big Ben strikes thirteen!
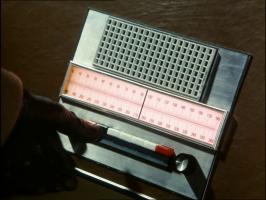
The driver turning on the radio. Good to know that BBC Radio 4 will still broadcast at 92-95FM in 2068.
Following this, the driver is knocked out again and wakes up in a side road somewhere. After hearing his story, Captain Blue works out that
the car park must be 1500 yards away from Big Ben. Using this information, Captains Blue and Scarlet manage to track
down the nuclear device and save the day.
After rewatching the episode recently, I realised that it would be possible to recreate this scene and hear Big Ben striking thirteen.
Where does Big Ben strike thirteen?
At the end of the episode, Captain Blue explains to Captain Scarlet that the effect was due to light travelling faster than sound: as the
driver had the radio on, he could hear Ben's bongs both from the tower and through the radio. As radio waves travel faster than
sound, the bongs over the radio can be heard earlier than the sound waves travelling through the air.
Further from the tower, the gap between when the two bongs are heard
is longer; and at just the right distance, the second bong on the radio will be heard at the same time as the first bong from the tower.
This leads to the appearance of thirteen bongs: the first bong is just from the radio, the next eleven are both radio and from the tower, and
the final bong is only from the tower.
Big Ben's bongs are approximately 4.2s apart, sound travels at 343m/s, and light travels at 3×10⁸m/s (this is so fast that it
could be assumed that the radio waves arrive instantly without changing the answer). Using these, we perform the following calculation:
$$\text{time difference} = \text{time for sound to arrive}-\text{time for light to arrive}$$
$$=\frac{\text{distance}}{\text{speed of sound}}-\frac{\text{distance}}{\text{speed of light}}$$
$$=\text{distance}\times\left(\frac1{\text{speed of sound}}-\frac1{\text{speed of light}}\right)$$
$$\text{distance}=\text{time difference}\div\left(\frac1{\text{speed of sound}}-\frac1{\text{speed of light}}\right)$$
$$=4.2\div\left(\frac1{343}-\frac1{3\times10^8}\right)$$
$$=1440\text{m}\text{ or }1574\text{ yards}$$
This is close to Captain Blue's calculation of 1500 yards (and to be fair to the Captain, he had to calculate it in his head in a few seconds).
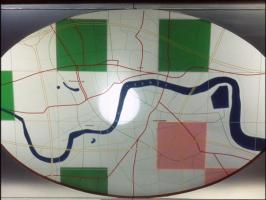
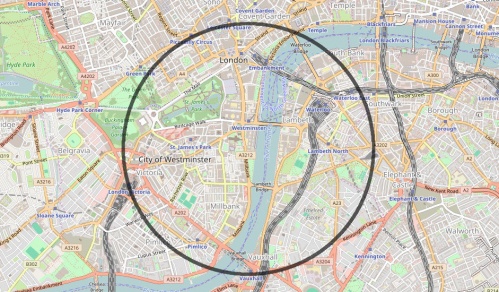
Plotting a circle of this radius centred at Big Ben gives the points where it may be possible to hear 13 bongs.
Again, the makers of Captain Scarlet got this right: their circle shown earlier is a very similar size to this one.
To demonstrate that this does work (and with a little help from TD and her camera),
I made the following video yesterday near Vauxhall station. I recommend using earphones to watch it as the later bongs are quite faint.
(Click on one of these icons to react to this blog post)
You might also enjoy...
Comments
Comments in green were written by me. Comments in blue were not written by me.
Very late to this but how excellent! My Gerry Andersen experiences were at the start of his output...I even watched Stingray in black and white.
(anonymous)
Add a Comment
2017-03-27
Tomorrow, the new 12-sided one pound coin is released.
Although I'm excited about meeting this new coin, I am also a little sad,
as its release ends the era in which all British coins are shapes of constant
width.
Shapes of constant width
A shape of constant width is a shape that is the same width in every direction,
so these shapes can roll without changing height. The most obvious such shape
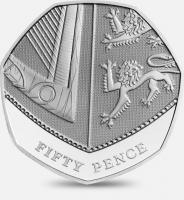
is a circle. But there are others, including the shape of the seven-sided 50p
coin.
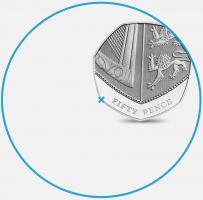
As shown below, each side of a 50p is part of a circle centred around the opposite corner.
As a 50p rolls, its height is always the distance between one of the corners and
the side opposite, or in other words the radius of this circle. As these circles
are all the same size, the 50p is a shape of constant width.
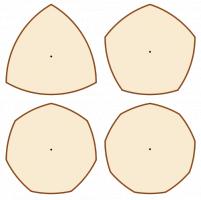
Shapes of constant width can be created from any regular polygon with an
odd number of sides, by replacing the sides by parts of circles centred at the
opposite corner. The first few are shown below.
It's also possible to create shapes of constant width from irregular polygons with an odd number,
but it's not possible to create them from polygons with an even number of sides.
Therefore, the new 12-sided pound coin will be the first non-constant width British coin since
the (also 12-sided) threepenny bit was phased out in 1971.
Back in 2014, I wrote to my MP in an attempt to find
out why the new coin was not of a constant width. He forwarded my letter to
the Treasury, but I never heard back from them.
Pizza cutting
When cutting a pizza into equal shaped pieces, the usual approach is to
cut along a few diameters to make triangles. There are other ways to fairly
share pizza, including the following (that has appeared here before as an answer to this puzzle):
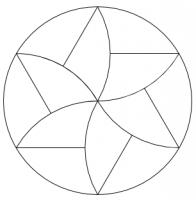
The slices in this solution are closely related to a triangle of constant
width. Solutions can be made using other shapes of constant width,
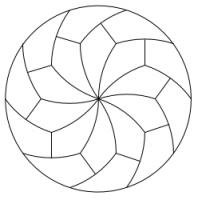
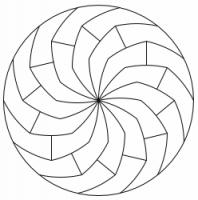
including the following, made using a constant width pentagon and heptagon (50p):
There are many more ways to cut a pizza into equal pieces. You can find them in Infinite families of monohedral disk tilings by Joel Haddley and Stephen Worsley [1].
You can't use the shape of a new pound coin to cut a pizza though.
Edit: Speaking of new £1 coins, I made this stupid video with Adam "Frownsend" Townsend about them earlier today:
References
[1] Infinite families of monohedral disk tilings by Joel Haddley and Stephen Worsley. December 2015. [link]
(Click on one of these icons to react to this blog post)
You might also enjoy...
Comments
Comments in green were written by me. Comments in blue were not written by me.
Add a Comment
2017-03-08
This post appeared in issue 05 of Chalkdust. I strongly
recommend reading the rest of Chalkdust.
Take a long strip of paper. Fold it in half in the same direction a few times. Unfold it and look at the shape the edge of the paper
makes. If you folded the paper \(n\) times, then the edge will make an order \(n\) dragon curve, so called because it faintly resembles a
dragon. Each of the curves shown on the cover of issue 05 of Chalkdust is an order 10 dragon
curve.
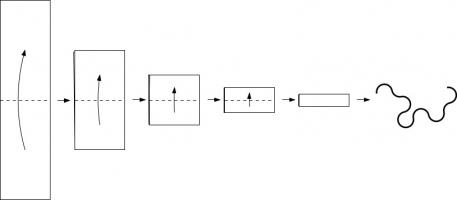
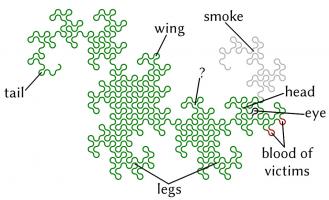
Top: Folding a strip of paper in half four times leads to an order four dragon curve (after rounding the corners). Bottom: A level 10 dragon curve resembling a dragon.
The dragon curves on the cover show that it is possible to tile the entire plane with copies of dragon curves of the same order. If any
readers are looking for an excellent way to tile a bathroom, I recommend getting some dragon curve-shaped tiles made.
An order \(n\) dragon curve can be made by joining two order \(n-1\) dragon curves with a 90° angle between their tails. Therefore, by
taking the cover's tiling of the plane with order 10 dragon curves, we may join them into pairs to get a tiling with order 11 dragon
curves. We could repeat this to get tilings with order 12, 13, and so on... If we were to repeat this ad infinitum we would arrive
at the conclusion that an order \(\infty\) dragon curve will cover the entire plane without crossing itself. In other words, an order
\(\infty\) dragon curve is a space-filling curve.
Like so many other interesting bits of recreational maths, dragon curves were popularised by Martin Gardner in one of his Mathematical Games columns in Scientific
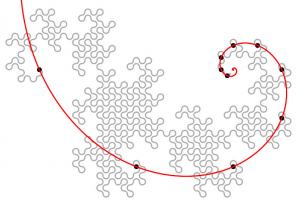
American. In this column, it was noted that the endpoints of dragon curves of different orders (all starting at the same point) lie on
a logarithmic spiral. This can be seen in the diagram below.
Although many of their properties have been known for a long time and are well studied, dragon curves continue to appear in new and
interesting places. At last year's Maths Jam conference, Paul Taylor gave a talk about my favourite surprise occurrence of
a dragon.
Normally when we write numbers, we write them in base ten, with the digits in the number representing (from right to left) ones, tens,
hundreds, thousands, etc. Many readers will be familiar with binary numbers (base two), where the powers of two are used in the place of
powers of ten, so the digits represent ones, twos, fours, eights, etc.
In his talk, Paul suggested looking at numbers in base -1+i (where i is the square root of -1; you can find more adventures of i here) using the digits 0 and 1. From right to left, the columns of numbers in this
base have values 1, -1+i, -2i, 2+2i, -4, etc. The first 11 numbers in this base are shown below.
| Number in base -1+i | Complex number |
| 0 | 0 |
| 1 | 1 |
| 10 | -1+i |
| 11 | (-1+i)+(1)=i |
| 100 | -2i |
| 101 | (-2i)+(1)=1-2i |
| 110 | (-2i)+(-1+i)=-1-i |
| 111 | (-2i)+(-1+i)+(1)=-i |
| 1000 | 2+2i |
| 1001 | (2+2i)+(1)=3+2i |
| 1010 | (2+2i)+(-1+i)=1+3i |
Complex numbers are often drawn on an Argand diagram: the real part of the number is plotted on the horizontal axis and the imaginary part
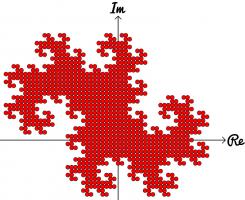
on the vertical axis. The diagram to the left shows the numbers of ten digits or less in base -1+i on an Argand diagram. The points form
an order 10 dragon curve! In fact, plotting numbers of \(n\) digits or less will draw an order \(n\) dragon curve.
Brilliantly, we may now use known properties of dragon curves to discover properties of base -1+i. A level \(\infty\) dragon curve covers
the entire plane without intersecting itself: therefore every Gaussian integer (a number of the form \(a+\text{i} b\) where \(a\) and
\(b\) are integers) has a unique representation in base -1+i. The endpoints of dragon curves lie on a logarithmic spiral: therefore
numbers of the form \((-1+\text{i})^n\), where \(n\) is an integer, lie on a logarithmic spiral in the complex plane.
If you'd like to play with some dragon curves, you can download the Python code used
to make the pictures here.
(Click on one of these icons to react to this blog post)
You might also enjoy...
Comments
Comments in green were written by me. Comments in blue were not written by me.
Add a Comment

