mscroggs.co.uk
mscroggs.co.uk

subscribe

Blog

 2017-02-25 
Recently, I've noticed a few great examples of misleading uses of numbers in news articles.
On 15 Feb, BBC News published a breaking news article with the headline "UK unemployment falls by 7,000 to 1.6m". This fall of 7,000 sounds big; but when compared to the total of 1.6m, it is insignificant. The change could more accurately be described as a fall from 1.6m to 1.6m.
But there is a greater problem with this figure. In the original Office of National Statistics (ONS) report, the fall of 7,000 was accompanied by a 95% confidence interval of ±80,000. When calculating figures about large populations (such as unemployment levels), it is impossible to ask every person in the UK whether they are employed or not. Instead, data is gathered from a sample and this is used to estimate the total number. The 95% confidence interval gives an idea of the accuracy of this estimation: 95% of the time, the true number will lie of the confidence interval. Therefore, we can think of the 95% confidence interval as being a range in which the figure lies (although this is not true, it is a helpful way to think about it).
Compared to the size of its confidence interval (±80,000), the fall of 7,000 is almost indistinguishable from zero. This means that it cannot be said with any confidence whether the unemployment level rose or fell. This is demonstrated in the following diagram.
A fall of 7,000 ± 80,000. The orange line shows no change.
To be fair to the BBC, the headline of the article changed to "UK wage growth outpaces inflation" once the article was upgraded from breaking news to a complete article, and a mention of the lack of confidence in the change was added.
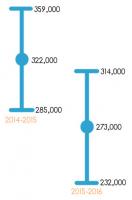
On 23 Feb, I noticed another BBC News with misleading figures: Net migration to UK falls by 49,000. This 49,000 is the difference between 322,000 (net migration for the year ending 2015) and 273,000 (net migration for the year ending 2016). However both these figures are estimates: in the original ONS report, they were placed in 95% confidence intervals of ±37,000 and ±41,000 respectively. As can be seen in the diagram below, there is a significant portion where these intervals overlap, so it cannot be said with any confidence whether or not net immigration actually fell.
Net migration in 2014-15 and 2015-16.
Perhaps the blame for this questionable figure lies with the ONS, as it appeared prominently in their report while the discussion of its accuracy was fairly well hidden. Although I can't shift all blame from the journalists: they should really be investigating the quality of these figures, however well advertised their accuracy is.
Both articles criticised here appeared on BBC News. This is not due to the BBC being especially bad with figures, but simply due to the fact that I spend more time reading news on the BBC than in other places, so noticed these figures there. I quick Google search reveals that the unemployment figure was also reported, with little to no discussion of accuracy, by The Guardian, the Financial Times, and Sky News.
×2      ×2      ×2      ×2      ×2
(Click on one of these icons to react to this blog post)

You might also enjoy...

Comments

Comments in green were written by me. Comments in blue were not written by me.
I've seen archaeologists claiming proof that event A happened before event B because the radiocarbon date of A was 50 years before B. Except the standard error on both dates was 100 years. They even showed the error bars in their own graphics, but seemed to not understand what it meant.

My favorite species of ignoring the measurement error is the metric conversion taken to way too many decimal places. The hike was 50 miles (80.467 kilometers) long.
Perry Ramsey
×1   ×1   ×1   ×1   ×1     Reply
 Add a Comment 


I will only use your email address to reply to your comment (if a reply is needed).

Allowed HTML tags: <br> <a> <small> <b> <i> <s> <sup> <sub> <u> <spoiler> <ul> <ol> <li> <logo>
To prove you are not a spam bot, please type "bisect" in the box below (case sensitive):

Archive

Show me a random blog post
 2025 

Jan 2025

Christmas (2024) is over
Friendly squares
 2024 
▼ show ▼
 2023 
▼ show ▼
 2022 
▼ show ▼
 2021 
▼ show ▼
 2020 
▼ show ▼
 2019 
▼ show ▼
 2018 
▼ show ▼
 2017 
▼ show ▼
 2016 
▼ show ▼
 2015 
▼ show ▼
 2014 
▼ show ▼
 2013 
▼ show ▼
 2012 
▼ show ▼

Tags

latex approximation graph theory radio 4 quadrilaterals countdown pascal's triangle graphs menace mathsjam martin gardner sound misleading statistics european cup logs rugby london underground coins determinants propositional calculus errors game show probability anscombe's quartet turtles numbers fractals error bars bots recursion london zines matrix of minors pizza cutting php 24 hour maths electromagnetic field stickers regular expressions draughts bubble bobble gerry anderson sport mathslogicbot pythagoras video games boundary element methods matrix of cofactors gaussian elimination manchester science festival pi approximation day realhats crochet chess logic a gamut of games harriss spiral javascript weak imposition simultaneous equations plastic ratio ucl interpolation ternary youtube kings people maths correlation matt parker machine learning geogebra live stream pac-man edinburgh preconditioning matrices platonic solids estimation finite element method chalkdust magazine tmip reddit puzzles data squares finite group data visualisation programming advent calendar manchester dataset raspberry pi hannah fry news sorting fonts books royal institution arithmetic newcastle cross stitch exponential growth oeis reuleaux polygons map projections hats matrix multiplication geometry mathsteroids phd flexagons python convergence weather station royal baby hyperbolic surfaces christmas card statistics sobolev spaces football guest posts curvature final fantasy games big internet math-off speed crossnumber mean logo talking maths in public bodmas rhombicuboctahedron stirling numbers dinosaurs polynomials pi standard deviation nine men's morris captain scarlet probability chebyshev frobel golden spiral inline code asteroids braiding national lottery friendly squares hexapawn signorini conditions folding tube maps runge's phenomenon accuracy wool dates binary christmas gather town game of life palindromes noughts and crosses fence posts bempp numerical analysis cambridge computational complexity datasaurus dozen craft the aperiodical wave scattering databet trigonometry light dragon curves world cup go inverse matrices golden ratio triangles folding paper tennis

Archive

Show me a random blog post
▼ show ▼
© Matthew Scroggs 2012–2025