
Blog
Mathsteroids
2018-07-06
This is a post I wrote for round 1 of The Aperiodical's Big Internet Math-Off 2018, where Mathsteroids lost to MENACE.
A map projection is a way of representing the surface of a sphere, such as the Earth, on a flat surface. There is no way to represent all the features of a sphere on a flat surface, so if you want a map that shows a certain feature of the world, then you map will have to lose some other feature of the world in return.
To show you what different map projections do to a sphere, I have created a version of the game Asteroids on a sphere. I call it Mathsteroids. You can play it here, or follow the links below to play on specific projections.
Mercator projection
The most commonly used map projection is the Mercator projection, invented by Gerardus Mercator in 1569. The Mercator projection preserves angles: if two straight lines meet at an angle \(\theta\) on a sphere, then they will also meet at an angle \(\theta\) on the map. Keeping the angles the same, however, will cause the straight lines to no longer appear straight on the map, and the size of the same object in two different place to be very different.
The angle preserving property means that lines on a constant bearing (eg 030° from North) will appear straight on the map. These constant bearing lines are not actually straight lines on the sphere, but when your ship is already being buffeted about by the wind, the waves, and the whims of drunken sailors, a reasonably straight line is the best you can expect.
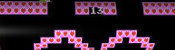
The picture below shows what three ships travelling in straight lines on the sphere look like on a Mercator projection.
)
To fully experience the Mercator projection, you can play Mathsteroids in Mercator projection mode here. Try flying North to see your spaceship become huge and distorted.
Gall–Peters projection
The Gall–Peters projection (named after James Gall and Arno Peters) is an area-preserving projection: objects on the map will have the same area as objects on the sphere, although the shape of the object on the projection can be very different to its shape on the sphere.
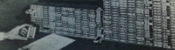
The picture below shows what three spaceships travelling in straight lines on a sphere look like on the Gall–Peters projection.
)
You can play Mathsteroids in Gall–Peters projection mode here. I find this one much harder to play than the Mercator projection, as the direction you're travelling changes in a strange way as you move.
Azimuthal projection
)
The emblem of the UN
An azimuthal projection makes a map on which the directions from the centre point to other points on the map are the same as the directions on the sphere. A map like this could be useful if, for example, you're a radio operator and need to quickly see which direction you should point your aerial to communicate with other points on the map.
The azimuthal projection I've used in Mathsteroids also preserves distances: the distance from the centre to the another points on the map is proportional to the actual distance on the sphere. This projection is used as the emblem of the UN.
The picture below shows three straight lines on this projection. You can play Mathsteroids in azimuthal mode here.
)
Craig retroazimuthal projection
A retroazimuthal projection makes a map on which the directions to the centre point from other points on the map are the same as the directions on the sphere. If you're thinking that this is the same as the azimuthal projection, then you're too used to doing geometry on flat surfaces: on a sphere, the sum of the angles in a triangle depends on the size of the triangle, so the directions from A to B and from B to A aren't as closely related as you would expect.
The Craig retroazimuthal projection was invented by James Ireland Craig in 1909. He used Mecca as his centre point to make a map that shows muslims across the world which direction they should face to pray.
The picture below shows what three spaceships travelling in a straight lines on a sphere looks like on this projection.
)
You can play Mathsteroids in Craig retroazimuthal mode here to explore the projection yourself. This is perhaps the hardest of all to play, as (a) two different parts of the sphere overlap on the map, and (b) the map is actually infinitely tall, so quite a bit of it is off the edge of the visible game area.
Stereographic projection
The final projection I'd like to show you is the stereographic projection.
Imagine that a sphere is sitting on a 2D plane. Take a point on the sphere. Imagine a straight line through this point and the point at the top of the sphere. The point where this line meets the 2D plane is stereographic projection of the point on the sphere.
)
The stereographic projection
This projection (backwards) can be used to represent the every complex number as a point on a sphere: this is called the Riemann sphere.
To make Mathseteroids playable after this projection, I split the sphere into 2 hemisphere and projected each seperately to give two circles. You can play Mathsteroids in stereographic projection mode here. Three spaceships travelling in straight lines on this projection are shown below.
)
... and if you still don't like map projections, you can still enjoy playing Mathsteroids on an old fashioned torus. Or on a Klein bottle or the real projective plane. Don't forget to take a short break from playing to head over to The Aperiodical and vote (voting now closed).
(Click on one of these icons to react to this blog post)
You might also enjoy...


Comments
Comments in green were written by me. Comments in blue were not written by me.
Add a Comment