Blog
The importance of estimation error
2017-02-25
Recently, I've noticed a few great examples of misleading uses of numbers in news articles.
On 15 Feb, BBC News published a breaking news article with the headline
"UK unemployment falls by 7,000 to 1.6m".
This fall of 7,000 sounds big; but when compared to the total of 1.6m, it
is insignificant. The change could more accurately be described as a fall from 1.6m to 1.6m.
But there is a greater problem with this figure. In the
original Office of National Statistics (ONS) report,
the fall of 7,000 was accompanied by a 95% confidence interval of ±80,000.
When calculating figures about large populations (such as unemployment levels), it is impossible to ask every person in the UK whether they
are employed or not. Instead, data is gathered from a sample and this is used to estimate the total number. The 95% confidence interval
gives an idea of the accuracy of this estimation: 95% of the time, the true number will lie of the confidence interval. Therefore, we can
think of the 95% confidence interval as being a range in which the figure lies (although this is not true, it is a helpful way to think
about it).
Compared to the size of its confidence interval (±80,000), the fall of 7,000 is almost indistinguishable from zero. This means that it
cannot be said with any confidence whether the unemployment level rose or fell. This is demonstrated in the following diagram.
To be fair to the BBC, the headline of the article changed to "UK wage growth outpaces inflation"
once the article was upgraded from breaking news to a complete article, and a mention of the lack of confidence in the change was added.
On 23 Feb, I noticed another BBC News with misleading figures: Net migration to UK falls by 49,000.
This 49,000 is the difference between
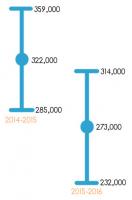
322,000 (net migration for the year ending 2015) and
273,000 (net migration for the year ending 2016).
However both these figures are estimates: in the original ONS report,
they were placed in 95% confidence intervals of ±37,000 and ±41,000 respectively. As can be seen in the diagram below,
there is a significant portion where these intervals overlap, so it cannot be said with any confidence whether or not net immigration actually fell.
Perhaps the blame for this questionable figure lies with the ONS, as it appeared prominently in their report while the discussion of its
accuracy was fairly well hidden. Although I can't shift all blame from the journalists: they should really be investigating the quality of these
figures, however well advertised their accuracy is.
Both articles criticised here appeared on BBC News. This is not due to the BBC being especially bad with figures, but simply due to the
fact that I spend more time reading news on the BBC than in other places, so noticed these figures there. I quick Google search reveals that the unemployment figure was
also reported, with little to no discussion of accuracy, by
The Guardian,
the Financial Times, and
Sky News.
(Click on one of these icons to react to this blog post)
You might also enjoy...
Comments
Comments in green were written by me. Comments in blue were not written by me.
Add a Comment


My favorite species of ignoring the measurement error is the metric conversion taken to way too many decimal places. The hike was 50 miles (80.467 kilometers) long.