
Blog
2020-11-22
This year, the front page of mscroggs.co.uk will once again feature an Advent calendar, just like
in the five previous Decembers.
Behind each door, there will be a puzzle with a three digit solution. The solution to each day's puzzle forms part of a logic puzzle:
It's nearly Christmas and something terrible has happened: you've just landed in a town in the Arctic circle with a massive bag of letters for Santa, but you've lost to instructions for how to get to Santa's house near the north pole. You need to work out where he lives and deliver the letters to him before Christmas is ruined for everyone.
Due to magnetic compasses being hard to use near the north pole, you brought with you a special Advent compass. This compass has nine numbered directions. Santa has given the residents of the town clues about a sequence of directions that will lead to his house; but in order to keep his location secret from present thieves, he gave each resident two clues: one clue is true, and one clue is false.
The residents' clues will reveal to you a seqeunce of compass directions to follow. You can try out your sequences on this map.
Behind each day (except Christmas Day), there is a puzzle with a three-digit answer. Each of these answers forms part of a resident's clue. You must use these clues to work out how to find Santa's house.
Ten randomly selected people who solve all the puzzles, find Santa's house, and fill in the entry form behind the door on the 25th will win prizes!
)
The winners will be randomly chosen from all those who submit the entry form before the end of 2020. Each day's puzzle (and the entry form on Christmas Day) will be available from 5:00am GMT. But as the winners will be selected randomly,
there's no need to get up at 5am on Christmas Day to enter!
As you solve the puzzles, your answers will be stored. To share your stored answers between multiple devices, enter your email address below the calendar and you will be emailed a magic link to visit on your other devices.
To win a prize, you must submit your entry before the end of 2020. Only one entry will be accepted per person. If you have any questions, ask them in the comments below or on Twitter.
So once December is here, get solving! Good luck and have a very merry Christmas!
(Click on one of these icons to react to this blog post)
You might also enjoy...


Comments
Comments in green were written by me. Comments in blue were not written by me.
@Dean: you can also go through each answer one at a time and change a digit; if the number of wrong answers goes up then your answer for that question was correct ×1 ×1
×1 ×1
A
@Dean: Yes, I'm planning to change how that bit works. Check back tomorrow or the next day for a more fun finish! ×1
Matthew
A bit harsh that we can’t tell exactly which answers are wrong! I won’t have time to revisit every puzzle - and its kind of less fun redoing something that is already correct... :-(
Dean
Add a Comment
2020-07-29
A week ago, it was 22 July: Pi Approximation Day.
22/7 (22 July in DD/M format) is very close to pi, closer in fact than 14 March's
approximation of 3.14 (M.DD).
During this year's Pi Approximation Day, I was wondering if there are other days that give good
approximations of interesting numbers. In particular, I wondered if there is a good 2π (or τ)
approximation day.
π is close to 22/7, so 2π is close to 44/7—but sadly there is no 44th July.
The best approximation day for 2π is 25th April, but 25/4 (6.25) isn't really close to
2π (6.283185...) at all. The day after Pi Approximation Day, however, is a good approximation of 2π-3 (as π-3 is
approximately 1/7). After noticing this, I realised that the next day would be a good approximation
of 3π-6, giving a nice run of days in July that closely approximate expressions involving pi.
After I tweeted about these three, Peter Rowlett suggested
that I could get a Twitter bot to do the work for me. So I made one:
@HappyApproxDay.
Since writing this post, Twitter broke @HappyApproxDay by changing their API, but the bot lives on on
Mathstodon (@HappyApproxDay@mathstodon.xyz)
and Bluesky (@happyapproxday.bsky.social).
@HappyApproxDay is currently looking for days that approximate expressions involving
π, τ, e, √2 and √3, and approximate the chosen expression better than
any other day of the year. There are an awful lot of ways to combine these numbers, so @HappyApproxDay@mathstodon.xyz
looks like it might be tooting quite a lot...
Edit: Added Mastodon and Bluesky links
(Click on one of these icons to react to this blog post)
You might also enjoy...


Comments
Comments in green were written by me. Comments in blue were not written by me.
Add a Comment
2020-05-15
This is a post I wrote for The Aperiodical's Big Lock-Down Math-Off. You can vote for (or against) me here until 9am on Sunday...
Recently, I came across a surprising fact: if you take any quadrilateral and join the midpoints of its sides, then you will form a parallelogram.
)
The blue quadrilaterals are all parallelograms.
The first thing I thought when I read this was: "oooh, that's neat." The second thing I thought was: "why?" It's not too difficult to show why this is true; you might like to pause here and try to work out why yourself before reading on...
To show why this is true, I started by letting \(\mathbf{a}\), \(\mathbf{b}\), \(\mathbf{c}\) and \(\mathbf{d}\) be the position vectors of the vertices of our quadrilateral. The position vectors of the midpoints of the edges are the averages of the position vectors of the two ends of the edge, as shown below.
)
)
The position vectors of the corners and the midpoints of the edges.
We want to show that the orange and blue vectors below are equal (as this is true of opposite sides of a parallelogram).
)
We can work these vectors out: the orange vector is$$\frac{\mathbf{d}+\mathbf{a}}2-\frac{\mathbf{a}+\mathbf{b}}2=\frac{\mathbf{d}-\mathbf{b}}2,$$
and the blue vector is$$\frac{\mathbf{c}+\mathbf{d}}2-\frac{\mathbf{b}+\mathbf{c}}2=\frac{\mathbf{d}-\mathbf{b}}2.$$
In the same way, we can show that the other two vectors that make up the inner quadrilateral are equal, and so the inner quadrilateral is a parallelogram.
Going backwards
Even though I now saw why the surprising fact was true, my wondering was not over. I started to think about going backwards.
It's easy to see that if the outer quadrilateral is a square, then the inner quadrilateral will also be a square.
)
If the outer quadrilateral is a square, then the inner quadrilateral is also a square.
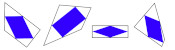
It's less obvious if the reverse is true: if the inner quadrilateral is a square, must the outer quadrilateral also be a square? At first, I thought this felt likely to be true, but after a bit of playing around, I found that there are many non-square quadrilaterals whose inner quadrilaterals are squares. Here are a few:
)
A kite, a trapezium, a delta kite, an irregular quadrilateral and a cross-quadrilateral whose innner quadrilaterals are all a square.
There are in fact infinitely many quadrilaterals whose inner quadrilateral is a square. You can explore them in this Geogebra applet by dragging around the blue point:
As you drag the point around, you may notice that you can't get the outer quadrilateral to be a non-square rectangle (or even a non-square parallelogram). I'll leave you to figure out why not...
(Click on one of these icons to react to this blog post)
You might also enjoy...


Comments
Comments in green were written by me. Comments in blue were not written by me.
Nice post! Just a minor nitpick, I found it weird that you say "In the same way, we can show that the other two vectors that make up the inner quadrilateral are equal, and so the inner quadrilateral is a parallelogram."
This is true but it's not needed (it's automatically true), you have in fact already proved that this is a parallelogram, by proving that two opposite sides have same length and are parallel (If you prove that the vectors EF and GH have the same coordinates, then EFHG is a parallelogram.)×2 ×2 ×2 ×2 ×2
This is true but it's not needed (it's automatically true), you have in fact already proved that this is a parallelogram, by proving that two opposite sides have same length and are parallel (If you prove that the vectors EF and GH have the same coordinates, then EFHG is a parallelogram.)
Vivien
mscroggs.co.uk is interesting as far as MATHEMATICS IS CONCERNED!×2 ×3 ×2 ×2 ×4
DEB JYOTI MITRA
Add a Comment
2020-05-03
This is a post I wrote for The Aperiodical's Big Lock-Down Math-Off. You can vote for (or against) me here until 9am on Tuesday...
A few years ago, I made @mathslogicbot (now relocated to @logicbot@mathstodon.xyz and @logicbot.bsky.social), a Twitter bot that tweets logical tautologies.
The statements that @mathslogicbot tweets are made up of variables (a to z) that can be either true or false, and the logical symbols
\(\lnot\) (not), \(\land\) (and), \(\lor\) (or), \(\rightarrow\) (implies), and \(\leftrightarrow\) (if and only if), as well as brackets.
A tautology is a statement that is always true, whatever values are assigned to the variables involved.
To get an idea of how to interpret @mathslogicbot's statements, let's have a look at a few tautologies:
\(( a \rightarrow a )\). This says "a implies a", or in other words "if a is true, then a is true". Hopefully everyone agrees that this is an always-true statement.
\(( a \lor \lnot a )\). This says "a or not a": either a is true, or a is not true
\((a\leftrightarrow a)\). This says "a if and only if a".
\(\lnot ( a \land \lnot a )\). This says "not (a and not a)": a and not a cannot both be true.
\(( \lnot a \lor \lnot \lnot a )\). I'll leave you to think about what this one means.
(Of course, not all statements are tautologies. The statement \((b\land a)\), for example, is not a tautology as is can be true or false depending on the
values of \(a\) and \(b\).)
While looking through @mathslogicbot's tweets, I noticed that a few of them are interesting, but most are downright rubbish.
This got me thinking: could I get rid of the bad tautologies like these, and make a list of just the "interesting" tautologies. To do this, we first need to
think of different ways tautologies can be bad.
Looking at tautologies the @mathslogicbot has tweeted, I decided to exclude:
- tautologies like \((a\rightarrow\lnot\lnot\lnot\lnot a)\) that contain more than one \(\lnot\) in a row.
- tautologies like \(((a\lor\lnot a)\lor b)\) that contain a shorter tautology. Instead, tautologies like \((\text{True}\lor b)\) should be considered.
- tautologies like \(((a\land\lnot a)\rightarrow b)\) that contain a shorter contradiction (the opposite of a tautology). Instead, tautologies like \((\text{False}\rightarrow b)\) should be considered.
- tautologies like \((\text{True}\lor\lnot\text{True})\) or \(((b\land a)\lor\lnot(b\land a)\) that are another tautology (in this case \((a\lor\lnot a)\)) with a variable replaced with something else.
- tautologies containing substatements like \((a\land a)\), \((a\lor a)\) or \((\text{True}\land a)\) that are equivalent to just writing \(a\).
- tautologies that contain a \(\rightarrow\) that could be replaced with a \(\leftrightarrow\), because it's more interesting if the implication goes both ways.
- tautologies containing substatements like \((\lnot a\lor\lnot b)\) or \((\lnot a\land\lnot b)\) that could be replaced with similar terms (in these cases \((a\land b)\) and \((a\lor b)\) respectively) without the \(\lnot\)s.
- tautologies that are repeats of each other with the order changed. For example, only one of \((a\lor\lnot a)\) and \((\lnot a\lor a)\) should be included.
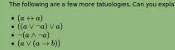
After removing tautologies like these, some of my favourite tautologies are:
- \(( \text{False} \rightarrow a )\)
- \(( a \rightarrow ( b \rightarrow a ) )\)
- \(( ( \lnot a \rightarrow a ) \leftrightarrow a )\)
- \(( ( ( a \leftrightarrow b ) \land a ) \rightarrow b )\)
- \(( ( ( a \rightarrow b ) \leftrightarrow a ) \rightarrow a )\)
- \(( ( a \lor b ) \lor ( a \leftrightarrow b ) )\)
- \(( \lnot ( ( a \land b ) \leftrightarrow a ) \rightarrow a )\)
- \(( ( \lnot a \rightarrow b ) \leftrightarrow ( \lnot b \rightarrow a ) )\)
You can find a list of the first 500 "interesting" tautologues here. Let me know on Twitter
which is your favourite. Or let me know which ones you think are rubbish, and we can further refine the list...
Edit: Added Mastodon and Bluesky links
(Click on one of these icons to react to this blog post)
You might also enjoy...

Comments
Comments in green were written by me. Comments in blue were not written by me.
Add a Comment
2020-03-31
Recently, you've probably seen a lot of graphs that look like this:
)
The graph above shows something that is growing exponentially: its equation is \(y=kr^x\), for some constants \(k\) and \(r\).
The value of the constant \(r\) is very important, as it tells you how quickly the value is going to grow. Using a graph of some data,
it is difficult to get an anywhere-near-accurate approximation of \(r\).
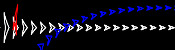
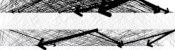
The following plot shows three different exponentials. It's very difficult to say anything about them except that they grow very quickly above around \(x=15\).
)
\(y=2^x\), \(y=40\times 1.5^x\), and \(y=0.002\times3^x\)
It would be nice if we could plot these in a way that their important properties—such as the value of the ratio \(r\)—were more clearly evident from the
graph. To do this, we start by taking the log of both sides of the equation:
$$\log y=\log(kr^x)$$
Using the laws of logs, this simplifies to:
$$\log y=\log k+x\log r$$
This is now the equation of a straight line, \(\hat{y}=m\hat{x}+c\), with \(\hat{y}=\log y\), \(\hat{x}=x\), \(m=\log r\) and \(c=\log k\). So if we plot
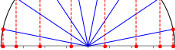
\(x\) against \(\log y\), we should get a straight line with gradient \(\log r\). If we plot the same three exponentials as above using a log-scaled \(y\)-axis, we get:
)
\(y=2^x\), \(y=40\times 1.5^x\), and \(y=0.002\times3^x\) with a log-scaled \(y\)-axis
From this picture alone, it is very clear that the blue exponential has the largest value of \(r\), and we could quickly work out a decent approximation of this value
by calculating 10 (or the base of the log used if using a different log) to the power of the gradient.
Log-log plots
Exponential growth isn't the only situation where scaling the axes is beneficial. In my research in finite and boundary element methods,
it is common that the error of the solution \(e\) is given in terms of a grid parameter \(h\) by a polynomial of the form
\(e=ah^k\),
for some constants \(a\) and \(k\).
We are often interested in the value of the power \(k\). If we plot \(e\) against \(h\), it's once again difficult to judge the value of \(k\) from the graph alone. The following
graph shows three polynomials.
)
\(y=x^2\), \(y=x^{1.5}\), and \(y=0.5x^3\)
Once again is is difficult to judge any of the important properties of these. To improve this, we once again begin by taking the log of each side of the equation:
$$\log e=\log (ah^k)$$
Applying the laws of logs this time gives:
$$\log e=\log a+k\log h$$
This is now the equation of a straight line, \(\hat{y}=m\hat{x}+c\), with \(\hat{y}=\log e\), \(\hat{x}=\log h\), \(m=k\) and \(c=\log a\). So if we plot
\(\log x\) against \(\log y\), we should get a straight line with gradient \(k\).
Doing this for the same three curves as above gives the following plot.
)
\(y=x^2\), \(y=x^{1.5}\), and \(y=0.5x^3\) with log-scaled \(x\)- and \(y\)-axes
It is easy to see that the blue line has the highest value of \(k\) (as it has the highest gradient, and we could get a decent approximation of this value by finding the line's gradient.
As well as making it easier to get good approximations of important parameters, making curves into straight lines in this way also makes it easier to plot the trend of real data.
Drawing accurate exponentials and polynomials is hard at the best of times; and real data will not exactly follow the curve, so drawing an exponential or quadratic of best fit will be an
even harder task. By scaling the axes first though, this task simplifies to drawing a straight line through the data; this is much easier.
So next time you're struggling with an awkward curve, why not try turning it into a straight line first.
(Click on one of these icons to react to this blog post)
You might also enjoy...
Comments
Comments in green were written by me. Comments in blue were not written by me.
Add a Comment
Did he?... did he really?... starts to look like it... yes he did! :D