
Blog
2018-07-06
This is a post I wrote for round 1 of The Aperiodical's Big Internet Math-Off 2018, where Mathsteroids lost to MENACE.
A map projection is a way of representing the surface of a sphere, such as the Earth, on a flat surface. There is no way to represent all the features of a sphere on a flat surface, so if you want a map that shows a certain feature of the world, then you map will have to lose some other feature of the world in return.
To show you what different map projections do to a sphere, I have created a version of the game Asteroids on a sphere. I call it Mathsteroids. You can play it here, or follow the links below to play on specific projections.
Mercator projection
The most commonly used map projection is the Mercator projection, invented by Gerardus Mercator in 1569. The Mercator projection preserves angles: if two straight lines meet at an angle \(\theta\) on a sphere, then they will also meet at an angle \(\theta\) on the map. Keeping the angles the same, however, will cause the straight lines to no longer appear straight on the map, and the size of the same object in two different place to be very different.
The angle preserving property means that lines on a constant bearing (eg 030° from North) will appear straight on the map. These constant bearing lines are not actually straight lines on the sphere, but when your ship is already being buffeted about by the wind, the waves, and the whims of drunken sailors, a reasonably straight line is the best you can expect.
The picture below shows what three ships travelling in straight lines on the sphere look like on a Mercator projection.
)
To fully experience the Mercator projection, you can play Mathsteroids in Mercator projection mode here. Try flying North to see your spaceship become huge and distorted.
Gall–Peters projection
The Gall–Peters projection (named after James Gall and Arno Peters) is an area-preserving projection: objects on the map will have the same area as objects on the sphere, although the shape of the object on the projection can be very different to its shape on the sphere.
The picture below shows what three spaceships travelling in straight lines on a sphere look like on the Gall–Peters projection.
)
You can play Mathsteroids in Gall–Peters projection mode here. I find this one much harder to play than the Mercator projection, as the direction you're travelling changes in a strange way as you move.
Azimuthal projection
)
The emblem of the UN
An azimuthal projection makes a map on which the directions from the centre point to other points on the map are the same as the directions on the sphere. A map like this could be useful if, for example, you're a radio operator and need to quickly see which direction you should point your aerial to communicate with other points on the map.
The azimuthal projection I've used in Mathsteroids also preserves distances: the distance from the centre to the another points on the map is proportional to the actual distance on the sphere. This projection is used as the emblem of the UN.
The picture below shows three straight lines on this projection. You can play Mathsteroids in azimuthal mode here.
)
Craig retroazimuthal projection
A retroazimuthal projection makes a map on which the directions to the centre point from other points on the map are the same as the directions on the sphere. If you're thinking that this is the same as the azimuthal projection, then you're too used to doing geometry on flat surfaces: on a sphere, the sum of the angles in a triangle depends on the size of the triangle, so the directions from A to B and from B to A aren't as closely related as you would expect.
The Craig retroazimuthal projection was invented by James Ireland Craig in 1909. He used Mecca as his centre point to make a map that shows muslims across the world which direction they should face to pray.
The picture below shows what three spaceships travelling in a straight lines on a sphere looks like on this projection.
)
You can play Mathsteroids in Craig retroazimuthal mode here to explore the projection yourself. This is perhaps the hardest of all to play, as (a) two different parts of the sphere overlap on the map, and (b) the map is actually infinitely tall, so quite a bit of it is off the edge of the visible game area.
Stereographic projection
The final projection I'd like to show you is the stereographic projection.
Imagine that a sphere is sitting on a 2D plane. Take a point on the sphere. Imagine a straight line through this point and the point at the top of the sphere. The point where this line meets the 2D plane is stereographic projection of the point on the sphere.
)
The stereographic projection
This projection (backwards) can be used to represent the every complex number as a point on a sphere: this is called the Riemann sphere.
To make Mathseteroids playable after this projection, I split the sphere into 2 hemisphere and projected each seperately to give two circles. You can play Mathsteroids in stereographic projection mode here. Three spaceships travelling in straight lines on this projection are shown below.
)
... and if you still don't like map projections, you can still enjoy playing Mathsteroids on an old fashioned torus. Or on a Klein bottle or the real projective plane. Don't forget to take a short break from playing to head over to The Aperiodical and vote (voting now closed).
(Click on one of these icons to react to this blog post)
You might also enjoy...


Comments
Comments in green were written by me. Comments in blue were not written by me.
Add a Comment
2018-06-16
This year, like every World Cup year, I've been collecting stickers to fill the official Panini World Cup sticker album.
Back in March, I calculated that I should expect it to cost £268.99 to fill this year's album (if I order the last 50 stickers).
As of 6pm yesterday, I need 47 stickers to complete the album (and have placed an order on the Panini website for these).
So... How much did it cost?
In total, I have bought 1781 stickers (including the 47 I ordered) at a cost of £275.93. The plot below shows
the money spent against the number of stickers stuck in, compared with the what I predicted in March.
)
To create this plot, I've been keeping track of exactly which stickers were in each pack I bought. Using this data, we can
look for a few more things. If you want to play with the data yourself, there's a link at the bottom to download it.
Swaps
The bar chart below shows the number of copies of each sticker I got (excluding the 47 that I ordered). Unsurprisingly, it looks a lot like
random noise.
)
The sticker I got most copies of was sticker 545, showing Panana player Armando Cooper.
)
Armando Cooper on sticker 545
I got swaps of 513 different stickers, meaning I'm only 169 stickers short of filling a second album.
First pack of all swaps
Everyone who has every done a sticker book will remember the awful feeling you get when you first get a pack of all swaps.
For me, the first time this happened was the 50th pack. The plot below shows when the first pack of all swaps occurred in 500,000 simulations.
)
Looks like I was really quite unlucky to get a pack of all swaps so soon.
Duplicates in a pack
In all the 345 packs that I bought, there wasn't a single pack that contained two copies of the same sticker.
In fact, I don't remember ever getting two of the same sticker in a pack. For a while I've been wondering if this is because Panini
ensure that packs don't contain duplicates, or if it's simply very unlikely that they do.
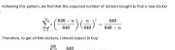
If it was down to unlikeliness, the probability of having no duplicates in one pack would be:
\begin{align}
\mathbb{P}(\text{no duplicates in a pack}) &= 1 \times\frac{681}{682}\times\frac{680}{682}\times\frac{679}{682}\times\frac{678}{682}\\
&= 0.985
\end{align}
and the probability of none of my 345 containing a duplicate would be:
\begin{align}
\mathbb{P}(\text{no duplicates in 345 packs})
&= 0.985^{345}\\
&= 0.00628
\end{align}
This is very very small, so it's safe to conclude that Panini do indeed ensure that packs do not contain duplicates.
The data
If you'd like to have a play with the data yourself, you can download it here. Let me know if
you do anything with it...
(Click on one of these icons to react to this blog post)
You might also enjoy...


Comments
Comments in green were written by me. Comments in blue were not written by me.
Add a Comment
2018-05-02
Every morning just before 7am, one of the Today Programme's presenters reads out a puzzle. Yesterday, it was this puzzle:

In a given month, the probability of a certain daily paper either running a story about inappropriate behaviour at a party conference or running one about somebody's pet being retrieved from a domestic appliance is exactly half the probability of the same paper containing a photo of a Tory MP jogging. The probability of no such photo appearing is the same as that of there being a story about inappropriate behaviour at a party conference. The probability of the paper running a story about somebody's pet being retrieved from a domestic appliance is a quarter that of its containing a photo of a Tory MP jogging. What are the probabilities the paper will (a) run the conference story, (b) run the pet story, (c) contain the jogging photo?

I'm not the only one to notice that some of Radio 4's daily puzzles are not great.
I think this puzzle is a great example of a terrible puzzle. You can already see the first problem with it: it's long and words and very hard to follow on the radio.
But maybe this isn't so important, as you can
read it here after it's been read out.
Once you've done this, you can re-write the puzzle as follows:
there are three news stories (\(A\), \(B\) and \(C\)) that the newspaper might publish in a month. We are given the following information:
$$\mathbb{P}(A\text{ or }B)=\tfrac12\mathbb{P}(C)$$
$$1-\mathbb{P}(C)=\mathbb{P}(A)$$
$$\mathbb{P}(B)=\tfrac14\mathbb{P}(C)$$
To solve this puzzle, we need use the formula \(\mathbb{P}(A\text{ or }B)=\mathbb{P}(A)+\mathbb{P}(B)-\mathbb{P}(A\text{ and }B)\).
These Venn diagrams justify this formula:
)
Venn diagrams showing that \(\mathbb{P}(A\text{ or }B)=\mathbb{P}(A)+\mathbb{P}(B)-\mathbb{P}(A\text{ and }B)\).
Using the information we were given in the question, we get:
\begin{align}
\tfrac12\mathbb{P}(C)&=\mathbb{P}(A\text{ or }B)\\
&=1-\mathbb{P}(C)+\tfrac14\mathbb{P}(C)-\mathbb{P}(A\text{ and }B)\\
\mathbb{P}(C)&=\tfrac45(1-\mathbb{P}(A\text{ and }B)).
\end{align}
At this point we have reached the second problem with this puzzle: there's no answer unless we make some extra assumptions, and the question doesn't make it clear what we can assume.
But let's give the puzzle the benefit of the doubt and try some assumptions.
Assumption 1: The events are mutually exclusive
If we assume that the events \(A\) and \(B\) are mutually exclusive—or, in other words, only one of these two articles can be published,
perhaps due to a lack of space—then we can use the fact that
$$\mathbb{P}(A\text{ and }B)=0.$$
This means that
\(\mathbb{P}(C)=\tfrac45\),
\(\mathbb{P}(A)=\tfrac15\), and
\(\mathbb{P}(B)=\tfrac15\). There's a problem with this answer, though: the three probabilities add up to more than 1.
This wouldn't be a problem, except we assumed that only one of the articles \(A\) and \(B\) could be published.
The probabilities adding up to more than 1 means that either \(A\) and \(C\) are not mutually exclusive or \(A\) and \(B\) are not mutually exclusive,
so \(C\) could be published alongside \(A\) or \(B\). There seems to be nothing special about the three news stories to mean that only some combinations
could be published together, so at this point I figured that this assumption was wrong and moved on.
Today, however, the answer was posted, and
this answer was given (without an working out). So we have a third problem with this puzzle: the answer that was given is wrong, or at the very best
is based on questionable assumptions.
Assumption 2: The events are independent
If we assume that the events are independent—so one article being published doesn't affect whether or not another is published—then
we may use the fact that
$$\mathbb{P}(A\text{ and }B)=\mathbb{P}(A)\mathbb{P}(B).$$
If we let \(c=\mathbb{P}(C)\), then we get:
\begin{align}
\tfrac12c&=\mathbb{P}(A)+\mathbb{P}(B)-\mathbb{P}(A\text{ and }B)\\
&=\mathbb{P}(A)+\mathbb{P}(B)-\mathbb{P}(A)\mathbb{P}(B)\\
&=1-c+\tfrac14c-\tfrac14(1-c)c\\
\tfrac14c^2-\tfrac32c+1&=0.
\end{align}
You can use your favourite formula to solve this to find that \(c=3-\sqrt5\), and therefore
\(\mathbb{P}(A)=\sqrt5-2\) and
\(\mathbb{P}(B)=\tfrac34-\tfrac{\sqrt5}4\).
In this case, our assumption appears to be more reasonable—as over the course of a month the stories published by a paper probably don't have
much of an effect on each other—but we have the fourth, and probably biggest problem with the puzzle: the question and answer are not interesting or surprising, and
the method is a bit tedious.
(Click on one of these icons to react to this blog post)
You might also enjoy...


Comments
Comments in green were written by me. Comments in blue were not written by me.
@Stefan: It's possible that that was intended but it's not completely clear. If that was the intention, I stick to my point that it's odd that the other story can be published alongside these two.
Matthew
Doesn’t the word ‘either’ in the opening phrase make A and B explicity exclusive?
Stefan
Add a Comment
2018-04-29
Two years ago, I built a copy of MENACE (Machine Educable Noughts And Crosses Engine). Since then, it's been to many Royal Institution masterclasses, visted Manchester and met David Attenborough. When I'm not showing them off, the 304 matchboxes that make up my copy of MENACE live in this box:
)
This box isn't very big, which might lead you to wonder how big MENACE-style machines would be for other games.
Hexapawn (HER)
In A matchbox game learning-machine by Martin Gardner [1], the game of Hexapawn was introduced. Hexapawn is played on a 3×3 grid, and starts with three pawns facing three pawns.
)
The pieces move like pawns: they may be either moved one square forwards into an empty square, or take another pawn diagonally (the pawns are not allowed to move forwards two spaces on their first move, as they can in chess).
You win if one of your pawns reaches the other end of the board. You lose if none of your pieces can move.
The game was invented by Martin Gardner as a good game for his readers to build a MENACE-like machine to play against, as there are only 19 positions that can face player two, so only 19 matchboxes are needed to make HER (Hexapawn Educable Robot). (HER plays as player two, as if player two plays well they can always win.)
Nine Men's Morris (MEME)
In Nine Men's Morris, two players first take turns to place pieces on the board, before taking turns to move pieces to adjacent spaces. If three pieces are placed in a row, a player may remove one of the opponent's pieces. It's a bit like Noughts and Crosses, but with a bit more chance of it not ending in a draw.
In Solving Nine Men's Morris by Ralph Gasser [2], the number of possible game states in Nine Men's Morris is given as approximately \(10^{10}\). To build MEME (Machine Educable Morris Engine), you would need this many matchboxes. These boxes would form a sphere with radius 41m: that's approximately the length of two tennis courts.
)
MEME: Machine Educable Morris Engine
As a nice bonus, if you build MEME, you'll also smash the world record for the largest matchbox collection.
Connect 4 (COFFIN)
In Symbolic classification of general two-player games by Stefan Edelkamp and Peter Kissmann [3], the number of possible game states in Connect 4 is given as 4,531,985,219,092. The boxes used to make COFFIN (COnnect Four Fighting INstrument) would make a sphere with radius 302m: approximately the height of the Eiffel Tower.
)
COFFIN: COnnect Four Fighting INstrument
Draughts/Checkers (DOCILE)
In Solving the game of Checkers by Jonathan Schaeffer and Robert Lake [4], the number of possible game states in Draughts is given as approximately \(5\times10^{20}\). The boxes needed to build DOCILE (Draughts Or Checkers Intelligent Learning Engine) would make a sphere with radius 151km.
)
DOCILE: Draughts Or Checkers Intelligent Learning Engine
If the centre of DOCILE was in London, some of the boxes would be in Sheffield.
Chess (CLAWS)
The number of possible board positions in chess is estimated to be around \(10^{43}\). The matchboxes needed to make up CLAWS (Chess Learning And Winning System) would fill a sphere with radius \(4\times10^{12}\)m.
)
CLAWS: Chess Learning And Winning System
If the Sun was at the centre of CLAWS, you might have to travel past Uranus on your search for the right box.
Go (MEGA)
The number of possible positions in Go is estimated to be somewhere near \(10^{170}\). To build MEGA (Machine Educable Go Appliance), you're going to need enough matchboxes to make a sphere with radius \(8\times10^{54}\)m.
)
MEGA: Machine Educable Go Appliance
The observable universe takes up a tiny space at the centre of this sphere. In fact you could fit around \(10^{27}\) copies of the universe side by side along the radius of this sphere.
It's going to take you a long time to look through all those matchboxes to find the right one...
References
[3] Symbolic classification of general two-player games by Stefan Edelkamp and Peter Kissmann. in Advances in Artificial Intelligence (edited by A.R. Dengel, K. Berns, T.M. Breuel, F. Bomarius, T.R. Roth-Berghofer), 2008. [link]
[4] Solving the game of Checkers by Jonathan Schaeffer and Robert Lake. Games of No Chance 29, 1996. [link]
(Click on one of these icons to react to this blog post)
You might also enjoy...

Comments
Comments in green were written by me. Comments in blue were not written by me.
Kind of like the "Blue Brain Project". They got a worm and fruitfly brain on the computer, I wanted to download the fruitfly brain for 2GB USB stick but it was over 12 TB. They uploaded half a mouse brain on their project so far.
Willem
Would Love to play with Coffin/Coffin2. Do you have the code on git or a JS/web version?... been kind of thinking of coding a version that only makes the match boxes as it needs them (to save on memory) but I heard you already have a version with optimizations (and my coding skill is rough at best)
John
Are you aware of any actual implementations of anything in matchboxes, games or otherwise?
Jam
Of course, to make CLAWS, you will have to leave a large gap in the centre of the matchbox sphere, to avoid the very real danger of fire. Furthermore, some redundancy is needed, to replace the boxes which will be damaged by the myriad hard objects which are whizzing around the solar system. For this latter reason alone, I propose that the machine would be impractical to make! ;-D×1 ×1 ×1
g0mrb
Add a Comment
2018-03-23
This morning, I heard about Arnie Ellis on the Today programme. Arnie is the first baby boy to be born in his family in five generations, following ten girls. According to John Humphrys, there is a 20,000-to-1 chance of this happening. Pretty quickly, I started wondering where this number came from.
After a quick Google, I found that this news story had appeared in many of today's papers, including the Sun and the Daily Mail. They all featured this 20,000-to-1 figure, which according to The Sun originally came from Ladbrokes.
What is the chance of this happening?
If someone is having a child, the probability of it being a girl is 0.5. The probability of it being a boy is also 0.5. So the probaility of having ten girls followed by a boy is
$$\left(\tfrac12\right)^{10}\times\tfrac12=\frac1{2048}.$$
If all 11 children were siblings, then this would be the chance of this happening—and it's a long way off the 20,000-to-1. But in Arnie's case, the situation is different. Luckily in the Daily Mail article, there is an outline of Arnie's family tree.
)
Here, you can see that the ten girls are spread over five generations. So the question becomes: given a baby, what is the probability that the child is male and his most recently born ten relatives on their mother's side are all female?
Four of the ten relatives are certainly female—Arnie's mother, grandmother, great grandmother and great great grandmother are all definitely female. This only leaves six more relatives, so the probability of a baby being in Arnie's position is
$$\left(\tfrac12\right)^{6}\times\tfrac12=\frac1{128}.$$
This is now an awful lot lower than the 20,000-to-1 we were told. In fact, with around 700,000 births in the UK each year, we'd expect over 5,000 babies to be born in this situation every year. Maybe Arnie's not so rare after all.
This number is based on the assumption that the baby's last ten relatives are spread across five generations. But the probability will be different if the relatives are spread over a different number of generations. Calculating the probability for a baby with any arrangement of ancestors would require knowing the likelihood of each arrangement of relatives, which would require a lot of data that probably doesn't exist. But the actual anwer is probably not too far from 127-to-1.
Where did 20,000-to-1 come from?
This morning, I emailed Ladbrokes to see if they could shed any light on the 20,000-to-1 figure. They haven't got back to me yet. (Although they did accidentally CC me when sending the query on to someone who might know the answer, so I'm hopeful.) I'll update this post with an explanaation if I do hear back.
Until then, there is one possible explanation for the figure: we have looked at the probability that a baby will be in this situation, but we could instead have started at the top of the family tree and looked at the probability that Beryl's next ten decendents were girls followed by a boy. The probability of this happening will be lower, as there is a reasonable chance that Beryl could have no female children, or no children at all. Looking at the problem this way, there are more ways for the situation to not happen, so the probability of it happening is lower.
But working the actually probability out in this way would again require data about how many children are likely in each generation, and would be a complicated calculation. It seems unlikely that this is what Ladbrokes did. Let's hope they shed some light on it...
(Click on one of these icons to react to this blog post)
You might also enjoy...


Comments
Comments in green were written by me. Comments in blue were not written by me.
Add a Comment